BALTIMORE (Stockpickr) -- Foreign stocks have been struggling in 2013, but that isn't stopping a handful of names from looking tradable this week.
Since the calendar flipped over to 2013, the S&P 500 has rallied 15%. Other countries haven't had quite the same upside over the course of this rally: the Euro Stoxx 50 is up a meager 4.8%; Korea's KOSPI is down 3.2%; India's Sensex has dropped 6%; Brazil's BOVESPA has sunk more than 15%.
One of the few exceptions has been Japan, with a 34% rally in the Nikkei 225 year-to-date.
According to the latest data released on Tuesday morning from the OECD, emerging economies are showing more sluggish economic recovery than more established countries are. A quick look at market performance anytime this year would've told you the same exact thing.
But that shouldn't stop you from trading foreign stocks in 2013. That's why we're taking a technical look at five foreign stocks to trade for gains this week.
For the unfamiliar, technical analysis is a way for investors to quantify qualitative factors, such as investor psychology, based on a stock's price action and trends. Once the domain of cloistered trading teams on Wall Street, technicals can help top traders make consistently profitable trades and can aid fundamental investors in better planning their stock execution.
So, without further ado, let's take a look at five technical setups worth trading now.
Canadian National Railway
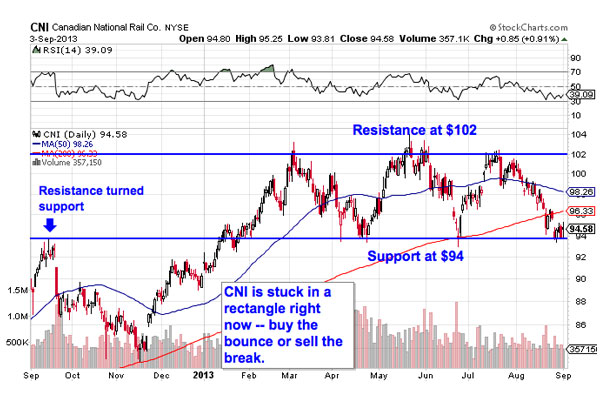
It's been a pretty lackluster year for shares of Canadian National Railway (CNI). The $40 billion rail transport stock has treaded water for most of 2013, gaining just under 4% in these last eight months. But that sideways churn is exactly what makes this stock tradable right now. Here's what I mean.
Sure, CNI has spent the year sideways, but what's key is that this stock has spent the year sideways in a tight, well-defined range with resistance at $102 and support down at $94. CNI's setup is called a rectangle pattern. It gets its name because it essentially "boxes in" shares in between those two price levels. Now, with shares testing support, fast-paced traders can buy the bounce on up to $102 -- or wait for a breakout to the top-side of the pattern through $102.
Either way, a dip through $94 is a sell signal for this stock. If buyers can't support this stock anymore, a failure at $94 is going to be the first sign in a long fall. Consider it a sell (or short) signal.
Nippon Telegraph & Telephone
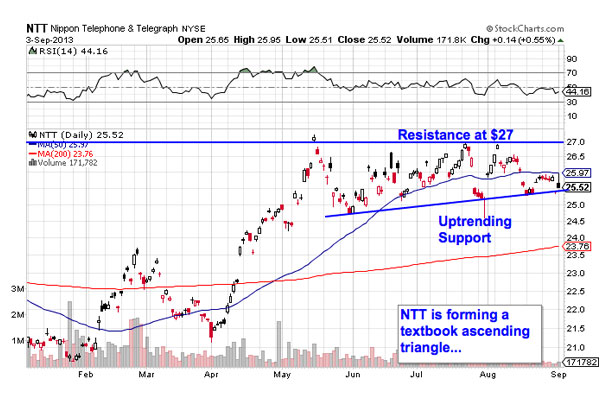
The strength in Japanese stocks is evident in Nippon Telegraph & Telephone (NTT), the $60 billion telco in the Land of the Rising Sun. Shares of NTT are up close to 22% since the first trading session in January -- and now, a technical setup points to even higher ground in the month ahead.
That's because NTT is currently forming an ascending triangle pattern, a bullish price setup that's formed by horizontal resistance above shares at $27 and uptrending support to the downside. Basically, as NTT bounces in between those two technical levels, it's getting squeezed closer and closer to a breakout above resistance. When that move above $27 happens, traders have their buy signal.
At first glance, the abundance of gaps on NTT's chart may be alarming. But those gaps, called suspension gaps, are just the rest of off hours trading on the Tokyo and London exchanges. From a technical standpoint they're irrelevant, but they're common in foreign traded names that are dual-listed overseas.
Costamare
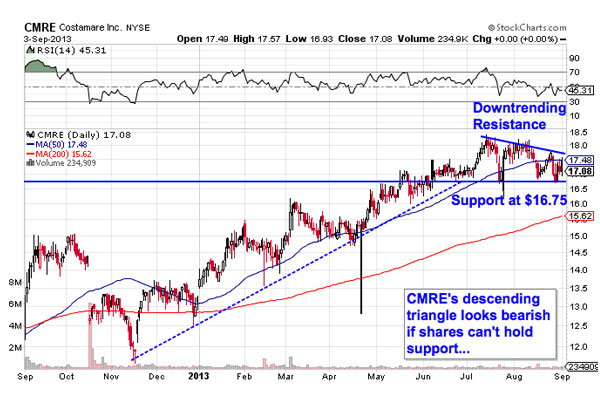
Thinks aren't looking quite so auspicious for shares of small-cap Greek shipping stock Costamare (CMRE). Greek equities enjoyed some buoyancy this year, the result of getting oversold due to headline risk during the economic crisis in the Eurozone. But this stock's down days don't look behind it yet.
That's because Costamare is currently forming the bearish opposite of the bullish pattern in NTT: a descending triangle. CMRE's setup is formed by downtrending resistance above shares and horizontal support down at $16.75 that shares are getting pushed down into. A move through $16.75 is the signal to sell this stock.
Whenever you're looking at any technical price pattern, it's critical to think in terms of buyers and sellers. Triangles, rectangles, and other price pattern names are a good quick way to explain what's going on in this stock, but they're not the reason it's tradable. Instead, it all comes down to supply and demand for shares.
That support line at $16.75 is a price where there's an excess of demand of shares; in other words, it's a place where buyers have been more eager to jump in and buy at lower levels than sellers have been to unload them. That's what makes the move below it so significant -- a breakdown indicates that sellers are finally strong enough to absorb all of the excess demand below that price level. Wait for that signal to happen before you bet against CMRE.
BT Group
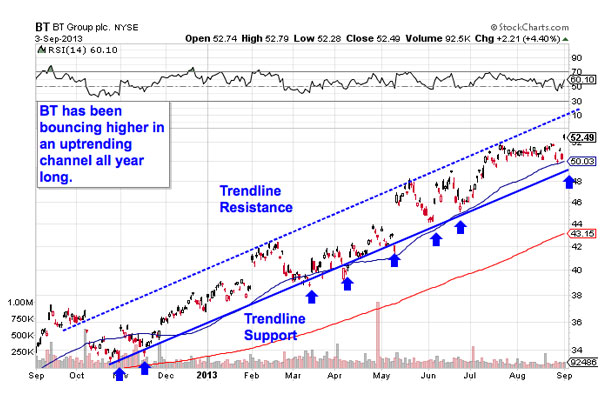
You don't have to be an expert technical analyst to figure out what's going on in shares of UK-based BT Group (BT). This chart has been moving up and to the right all year long, bouncing its way higher in a tight-range. So even though shares of BT have already made their way 38% higher since the start of the year, this stock is well positioned to keep its trajectory going.
BT has had the same trendline support level in place since all the way back in November, a level that held when the S&P broke its own similarly-positioned uptrend. That's a considerable sign of strength. Now the ideal time to be a buyer in BT comes on a bounce off of that support level.
Buying off a support bounce makes sense for two big reasons: it's the spot where shares have the furthest to move up before they hit resistance, and it's the spot where the risk is the least (because shares have the least room to move lower before you know you're wrong). While BT could stand to pull back some before it makes sense to jump in, the strength of this channel makes it worth watching now.
If you decide to jump in, I'd recommend keeping a protective stop in place at the 50-day moving average.
KB Financial Group
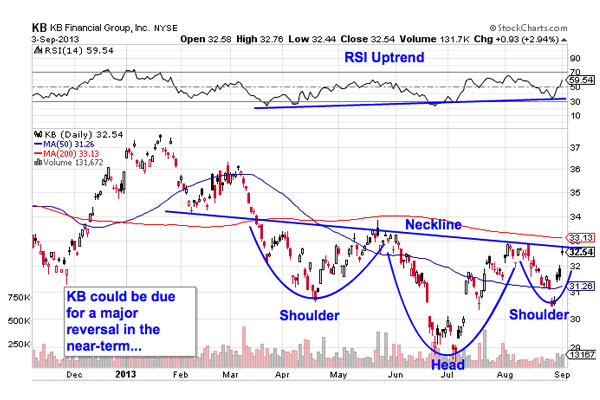
Korean bank KB Financial Group (KB) has a chart that's looked a whole lot less attractive year-to-date than most of the other names on this list. But with shares pointing to some early signs of a major reversal, traders need to watch KB closely this week.
KB is currently forming an inverse head and shoulders setup, a bullish reversal pattern that indicates exhaustion among sellers. The inverse head and shoulders is formed by two swing lows that bottom out at approximately the same price level (the shoulders), separated by a deeper swing low (the head). The buy signal comes when shares push through the neckline that's acted as resistance over the course of the pattern. Since this setup has been forming in the long-term, the upside implications are long-term once it triggers.
Follow Stockpickr on Twitter and become a fan on Facebook.
At the time of publication, author had no positions in stocks mentioned.
Jonas Elmerraji, CMT, is a senior market analyst at Agora Financial in Baltimore and a contributor to TheStreet. Before that, he managed a portfolio of stocks for an investment advisory returned 15% in 2008. He has been featured in Forbes , Investor's Business Daily, and on CNBC.com. Jonas holds a degree in financial economics from UMBC and the Chartered Market Technician designation.
Follow Jonas on Twitter @JonasElmerraji
No comments:
Post a Comment